With my background in construction I have always kept an interest in property, it’s my natural home if you’ll pardon the pun. What’s troubled me as an economist is the nature of this market, particularly in the last few years. Whilst it’s common knowledge that the market is strained – and by market I mean the free markets ability to provide houses for those that need them – until I looked at the data I was unaware just how bizarre it had become.
A basic bit of economics tells us that more demand pushes prices up, more supply brings them down. If there’s shortage of houses then the answer is to build more. Simple enough. The demand bit can be modified too of course. A recession should dry up money a little and perhaps see a fall in demand and a reduction in price (unless the product/commodity is being
used as a safe haven in the way gold is). This is all simple enough.
So let’s look at the data (care of http://www.landregistry.gov.uk/public/information/public-data/hpi-background):
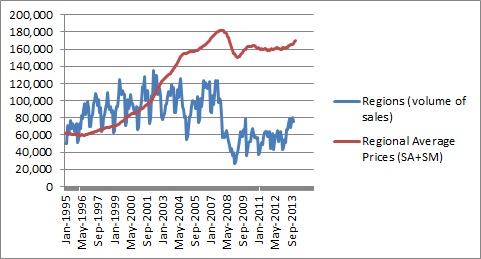
In this first chart we can see that as activity grew from 1995 – 2007 so did prices. More purchases took place and prices rose. Prices started doing something interesting around 2003 onward – they started accelerating away from volumes. This would suggest demand was starting to outstrip supply. Bang. 2007 and everything drops. Well volumes drop a lot, prices only marginally. Then something strange happens – volumes hardly recover at all but prices do. We have a situation where there is less activity, markedly so, but restored prices. Why have the Government targeted demand and not supply in what seems to be an inelastic market? Why have they allowed cheap lending and help to buy and yet done little to help the supply side? Where are the reductions in red tape, liberations to planning restrictions and other positive measures that would boost supply and control prices?
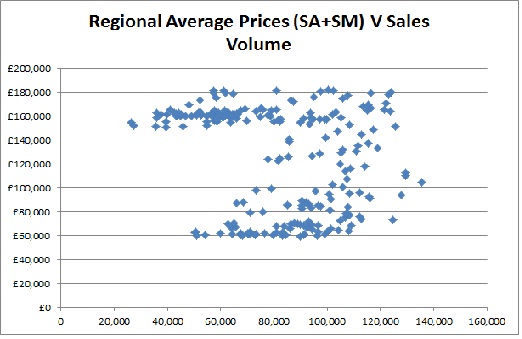
There is no correlation between volume and price - pretty much none at all as this chart shows.


 RSS Feed
